How to use Open Data from Vienna in QGIS and other software
published 2022-02-21 (last changed on 2022-04-12) by
The city of Vienna publishes a lot of datasets under a free license (CC BY 4.0 and a large fraction of them are geospatial data (like the list of parking zones I use in my parking app).
# Direct download of (geo)JSON, CSV or shapefile data
The dataset pages (I will be using the dataset of all public transport stops as an example) already contain working direct links to the export in various formats by clicking on the “Zur Ressource” buttons.
But as long as we know the name of the dataset (in this example ogdwien:HALTESTELLEWLOGD) we can also format the export URLs ourselves like this:
https://data.wien.gv.at/daten/geo?service=WFS&request=GetFeature&version=1.1.0&typeName=TYPENAME&srsName=EPSG:4326&outputFormat=FORMAT
replacing TYPENAME with e.g. and ogdwien:HALTESTELLEWLOGD and FORMAT with one of shape-zip (for a ZIP file containing the shapefile), json (for geojson) or csv. (check the documentation for more details on the formats.
This also exports the data in the EPSG:4326 coordinate system which allows you to e.g. display the data directly on an OpenStreetMap map.
If you want to see all datasets that are published by the City of Vienna, you can get them as an XML document at https://data.wien.gv.at/daten/wms?service=WMS&request=GetCapabilities&version=1.1.1.
# Browse Datasets in QGIS
If you want to browse through all datasets visually, you can load them into QGIS. (This is based on this instruction by basemap.at, but also explains how to load the actual data instead of an image layer).
- Open QGIS
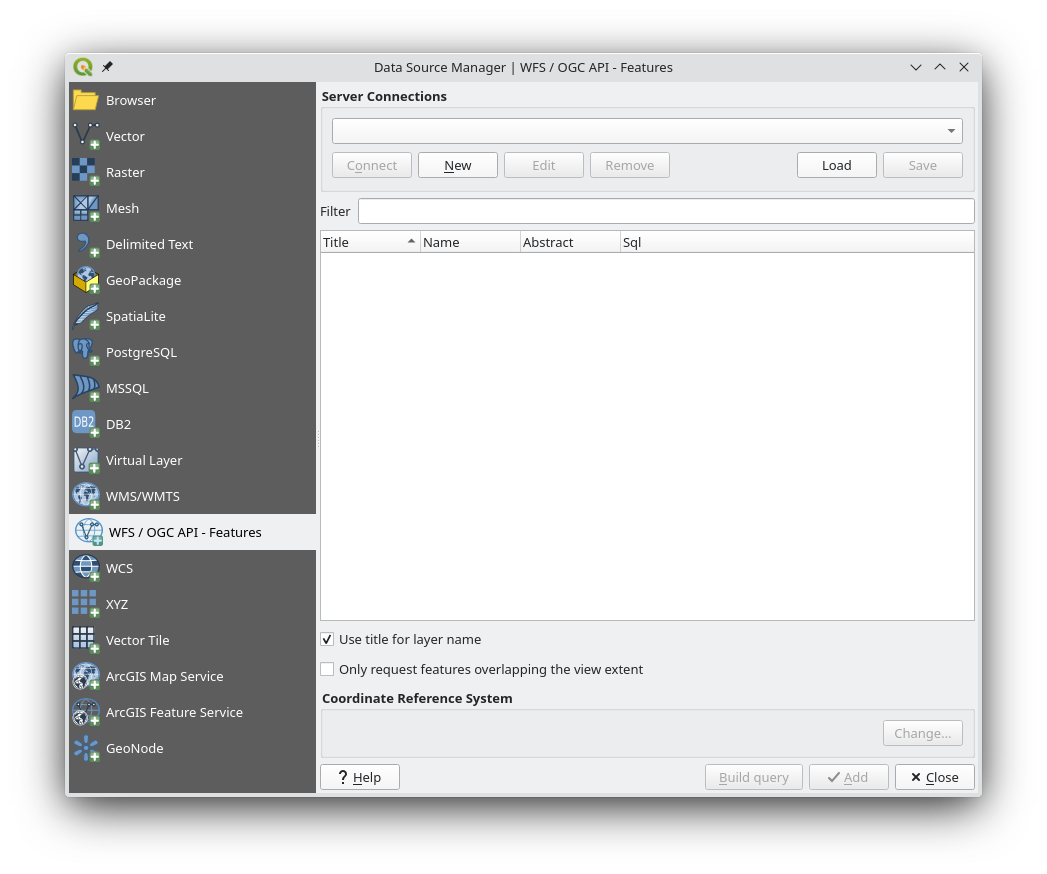
- Open the “Data Source Manager” (“Datenquellenverwaltung”)
- (optionally go to XYZ Connections and add
https://tile.openstreetmap.org/{z}/{x}/{y}.png, so you have an OpenStreetMap layer in the background) - Select “WFS” in the sidebar.
- Create a new entry and set the URL to
https://data.wien.gv.at/daten/geo?version=1.1.0&service=WFS&request=GetCapabilities(same as above, but with/geoinstead of/wms). All other changes can be left at the default.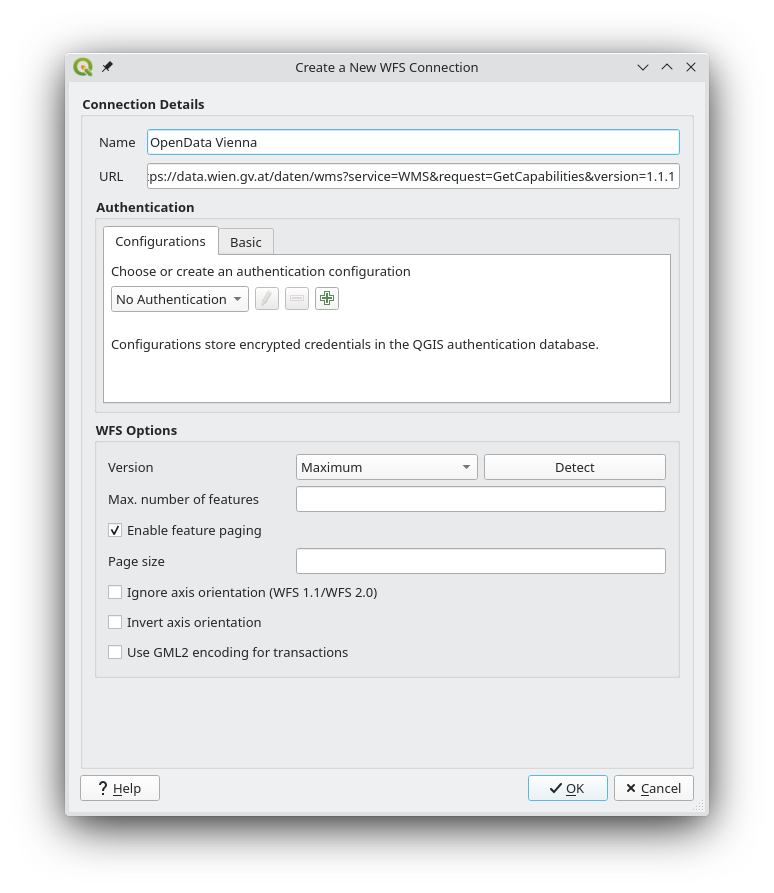
- Click “Connect” (“Verbinden”) and you should now see the list of all datasets.
- You can now add a dataset as a layer.
- You probably won’t see the data inside of Austria, as we still have the wrong projection set. (All datasets seem to be in
EPSG:31256). You can either fix this, by changing your whole map to this projection (with the button in the bottom right) or by specifying the projection for this layer. For the latter, righ-click on the layer and select “Layer CRS” (“Layer-KBS”) -> “Set Layer CRS…” (“KBS für Layer setzten…”) and selectEPSG:31256. Now you should see all datapoints at their right position and can explore them using the “Identify Features” tool (CTRL+SHIFT+I)
If you don’t see any data in your map and the layer just shows an icon like this,